Exercises · Q10
Q.
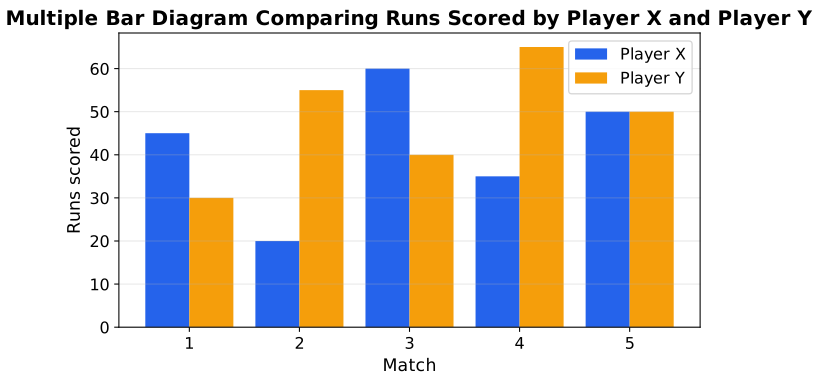
The runs scored by two batsmen, Player X and Player Y, in five matches are given below. Draw a multiple bar diagram to compare them, and state which player scored more runs in total.
| Match | 1 | 2 | 3 | 4 | 5 |
|---|---|---|---|---|---|
| Player X | 45 | 20 | 60 | 35 | 50 |
| Player Y | 30 | 55 | 40 | 65 | 50 |
West Bengal WbchseTextbookSubjectiveImportance★★★★★est
23% · 3/13 Questions
You're viewing a preview — the full solution, concept, methods & PYQ mapping are locked.
Start your 14-day free trial to unlock the full solution →Step 1 — Draw the multiple bar diagram. For each match (1–5), draw two touching bars — one for Player X, one for Player Y — with a small gap between each match's pair.
Step 2 — Total Player X's runs. : , , , .
Step 3 — Total Player Y's runs. : , , , .
Step 4 — Compare. , so Player Y scored more overall, by runs. …
Unlock everything free for 14 days
- Full step-by-step solutions
- Concept-first explanations
- Methods, shortcuts & mistakes
- PYQ mapping + timed mock tests
Full access for 14 days. No credit card required.