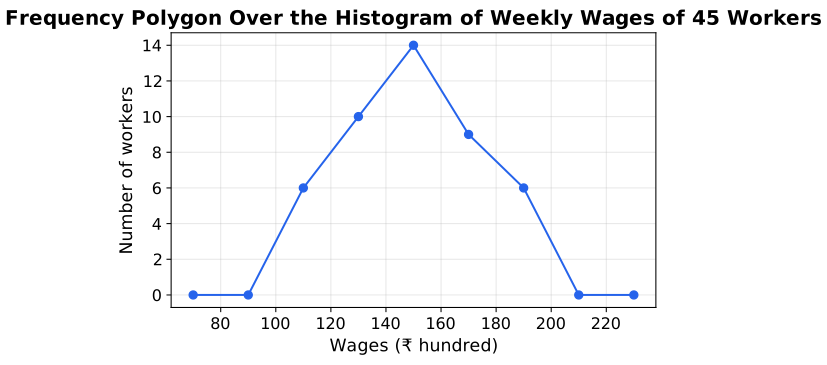
The weekly wages (in ₹ hundred) of 45 workers are grouped as follows. Draw a histogram for this distribution, and superimpose its frequency polygon on the same axes.
| Wages (₹ hundred) | 100–120 | 120–140 | 140–160 | 160–180 | 180–200 |
|---|---|---|---|---|---|
| Number of workers | 6 | 10 | 14 | 9 | 6 |
You're viewing a preview — the full solution, concept, methods & PYQ mapping are locked.
Start your 14-day free trial to unlock the full solution →Step 1 — Verify the total. , matching the 45 workers stated.
Step 2 — Draw the histogram. Since all classes have equal width (20), draw five adjacent rectangles over boundaries with heights .
Step 3 — Find the class marks for the frequency polygon. gives .
Step 4 — Add the two zero-frequency closing points. The imaginary class before – is –, midpoint ; the imaginary class after – is –, midpoint . Both are assigned frequency .
Step 5 — Draw the frequency polygon on the same axes. Plot and join consecutively with straight lines, directly over the histogram just drawn.
Unlock everything free for 14 days
- Full step-by-step solutions
- Concept-first explanations
- Methods, shortcuts & mistakes
- PYQ mapping + timed mock tests
Full access for 14 days. No credit card required.