The number of cars sold by a dealer over five years is given below. Draw a simple bar diagram to represent this data, and find (a) the year with the lowest sales, and (b) the overall percentage increase in sales from 2019 to 2023.
| Year | 2019 | 2020 | 2021 | 2022 | 2023 |
|---|---|---|---|---|---|
| Cars sold | 80 | 60 | 95 | 110 | 130 |
Step 1 — Draw the simple bar diagram. Mark the five years on the X-axis, cars sold on the Y-axis, and draw five equal-width bars from a zero baseline with heights 80, 60, 95, 110, 130.
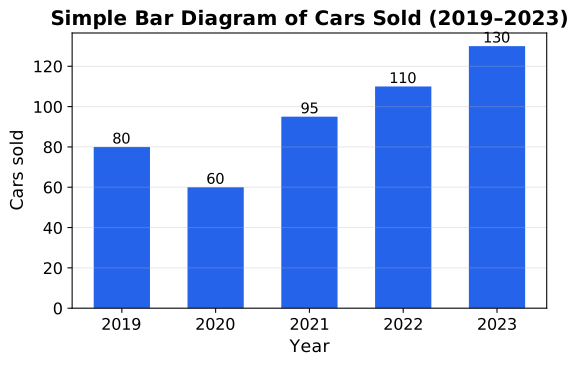
Step 2(a) — Find the lowest bar. Comparing , the smallest is , in 2020.
Step 2(b) — Compute the percentage increase, 2019 to 2023.
Independent check. Verifying the percentage a second way: — multiplying the 2019 figure by correctly reproduces the 2023 figure, confirming the percentage.
(a) Lowest sales: 2020, with 60 cars sold. (b) Sales increased by 50 cars, a 62.5% rise, from 2019 (80 cars) to 2023 (130 cars).
Unlock everything free for 14 days
- Full step-by-step solutions
- Concept-first explanations
- Methods, shortcuts & mistakes
- PYQ mapping + timed mock tests
Full access for 14 days. No credit card required.