Worked Examples · Example 4
Q.
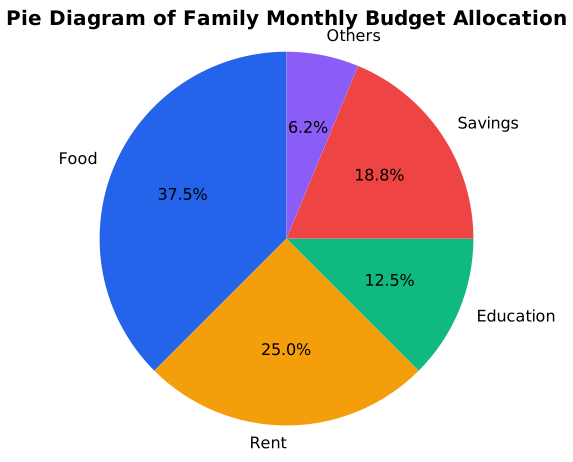
A family's monthly budget of ₹16,000 is allocated as follows. Draw a pie diagram to represent this data, showing the angle of each sector.
| Head | Food | Rent | Education | Savings | Others |
|---|---|---|---|---|---|
| Amount (₹) | 6,000 | 4,000 | 2,000 | 3,000 | 1,000 |
West Bengal WbchseTextbookSubjectiveImportance★★★★★est
77% · 10/13 Questions
You're viewing a preview — the full solution, concept, methods & PYQ mapping are locked.
Start your 14-day free trial to unlock the full solution →The angle of each sector is , with total .
Step 1 — Compute each angle.
Step 2 — Check the angles sum to 360°. ✓ — this check confirms no arithmetic slip.
Step 3 — Draw the pie diagram.
Unlock everything free for 14 days
- Full step-by-step solutions
- Concept-first explanations
- Methods, shortcuts & mistakes
- PYQ mapping + timed mock tests
Full access for 14 days. No credit card required.