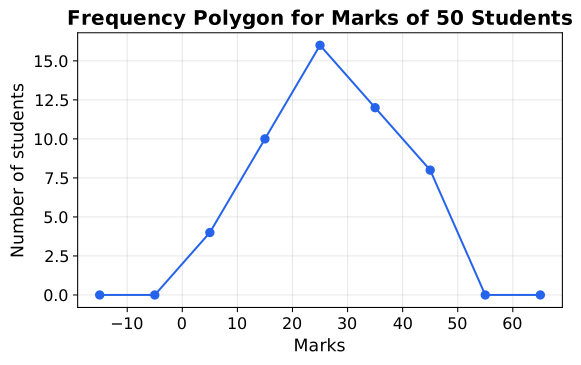
Q.Using the same marks distribution as Worked Example 5 (50 students, classes 0–10 to 40–50 with frequencies 4, 10, 16, 12, 8), draw the frequency polygon, showing how it is closed to the X-axis at both ends.
You're viewing a preview — the full solution, concept, methods & PYQ mapping are locked.
Start your 14-day free trial to unlock the full solution →Step 1 — Compute the class marks. For classes of width 10 starting at 0: , giving for the five classes 0–10 through 40–50.
Step 2 — Plot the class marks against frequencies. .
Step 3 — Close the polygon to the X-axis. Immediately before the first class (0–10) is the imaginary class –, with midpoint and assumed frequency ; immediately after the last class (40–50) is the imaginary class –, with midpoint and assumed frequency . Adding the points and and joining every point in sequence with straight lines closes the figure onto the X-axis at both ends, making it a genuine closed polygon.
Unlock everything free for 14 days
- Full step-by-step solutions
- Concept-first explanations
- Methods, shortcuts & mistakes
- PYQ mapping + timed mock tests
Full access for 14 days. No credit card required.