Biology · Ch 8 — Respiration and Circulation
Electrocardiogram
Electrocardiogram
An electrocardiogram (ECG) is a graphical recording — printed out or shown on screen — of the small electrical changes detectable at the body's surface as they spread through the walls of the heart during each beat; the instrument that detects, amplifies and records this signal is called an ECG machine, or electrocardiograph. The signal is picked up through electrodes placed at standard positions: four limb electrodes (two on the arms, two on the legs) and six chest electrodes.
A normal ECG trace shows three recognisable waves in each cycle. The P-wave is a small upward deflection representing atrial depolarisation (the electrical trigger for atrial contraction). The QRS complex follows — a brief downward dip, then a sharp, tall upward spike, then another downward dip — representing ventricular depolarisation (the trigger for ventricular contraction; it is large because the ventricles have much more muscle mass than the atria). The T-wave, a small, broad, gently raised wave, represents ventricular repolarisation (the ventricles' electrical recovery before the next beat). By examining the shape of these waves and the timing between them (such as the interval from one R-wave peak to the next, which marks the length of one cardiac cycle), a physician can pick up abnormalities in the heart's conducting pathway, enlargement of its chambers, damage to the cardiac muscle, reduced blood supply to the heart, and the underlying cause of chest pain.
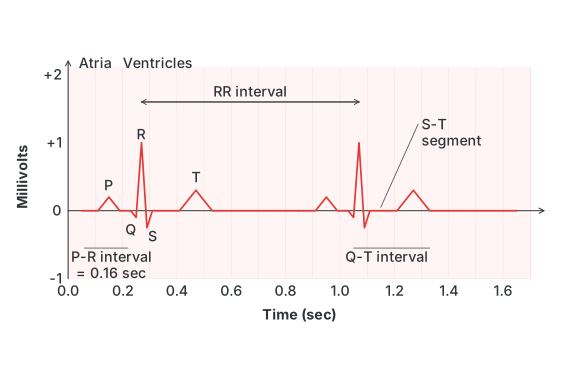
Drawn by us to help you understand the concept clearly, and verified to make sure it's accurate. For exams, practice from your textbook's own diagram.
What this figure shows. A trace of voltage (in millivolts, y-axis) against time in seconds (x-axis) showing the repeating waveform of one heartbeat. A small upward bump, the P-wave, appears first and corresponds to the atria depolarising (contracting). After a short flat gap (the P-R interval), a sharp, tall spike — a small downward dip followed by a large upward spike and another downward dip, together called the QRS complex — corresponds to the ventricles depolarising (contracting). A broader, gentler upward bump, the T-wave, follows and corresponds to the ventricles repolarising (relaxing). The distance from one R-wave …
Curiosity …